CLR Pro filer Steps for testing Generations
The primary function of CLR Profiler is to enable you to understand how your application interacts with the managed, garbage-collected heap. Some of the more important things that you can investigate include:- Who allocates what on the managed heap.
- Which objects survive on the managed heap.
- Who is holding on to objects.
- What the garbage collector does over the lifetime of your application.
ASP.NET or Window or Any .Net application:
Download the CLR Profiler :
http://clrprofiler.codeplex.com/releases/view/97738
http://msdn.microsoft.com/en-us/library/ff650691.aspx
http://download.microsoft.com/download/4/4/2/442d67c7-a1c1-4884-9715-803a7b485b82/clr%20profiler.exe.
- Run CLR Profiler.exe
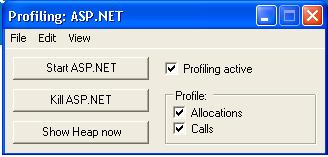
The following screen appears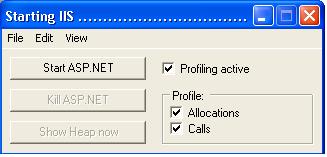
Make sure that the following check boxes are selected:
- Profiling active
- Allocations
- Calls
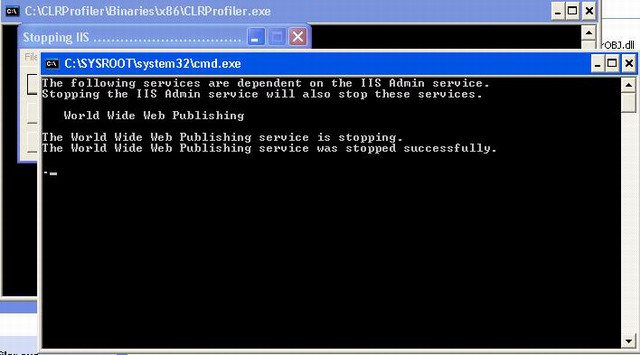
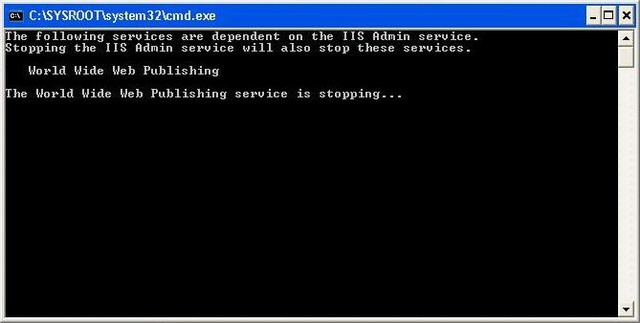
- Go to File Menu. From the options available, select ‘Profile ASP.NET or Window or Any .Net This stops IIS Admin Services which stops other dependant
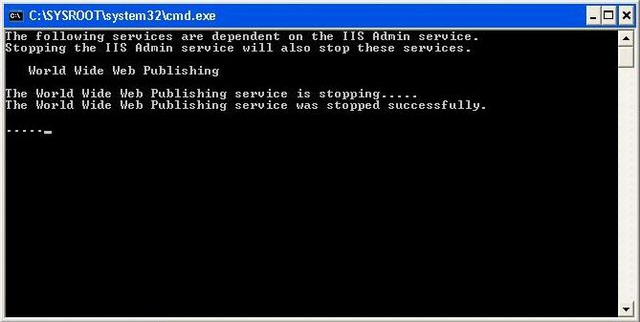
services (World Wide Web Publishing Services). Then World Wide Web
Publishing Service is restarted. The following screen then appears:
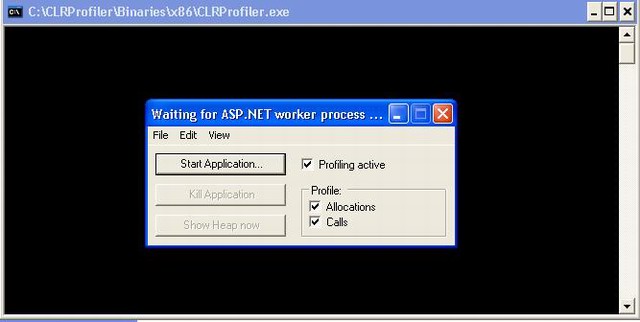
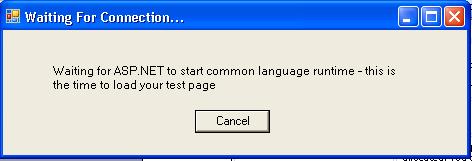
- At this point, start the application in the browser (Open a new browser window) Note: Do not refresh an already opened application.
- Next, the following screen appears:
Browse through the pages you want to profile, and then click on “Kill ASP.NET or Window or Any .Net Applications”.
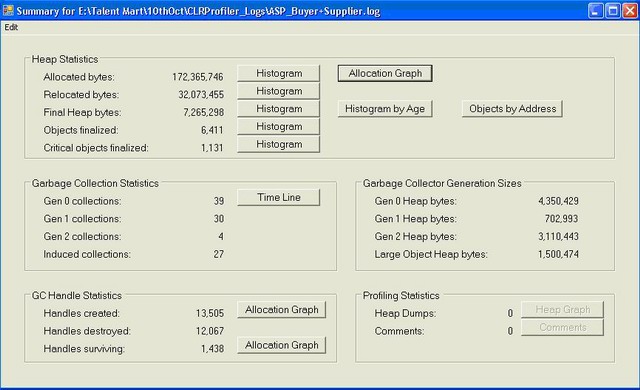
- Finally, the following summary report is generated.
Various options available can be viewed by clicking on respective Histogram buttons.
Sample Profiling
Baseline profiling for the Sample Application:Snap shot of the profiling summary
Click Histogram associated with “Allocated bytes” Allocated Bytes Histogram Part 1:

Colors representing different Object types are specified in the right side of the window. When you scroll through the bars, it displays the object type, total memory occupied by that object, total instances created and the average size of an instance.
Allocated Bytes Histogram part 2:
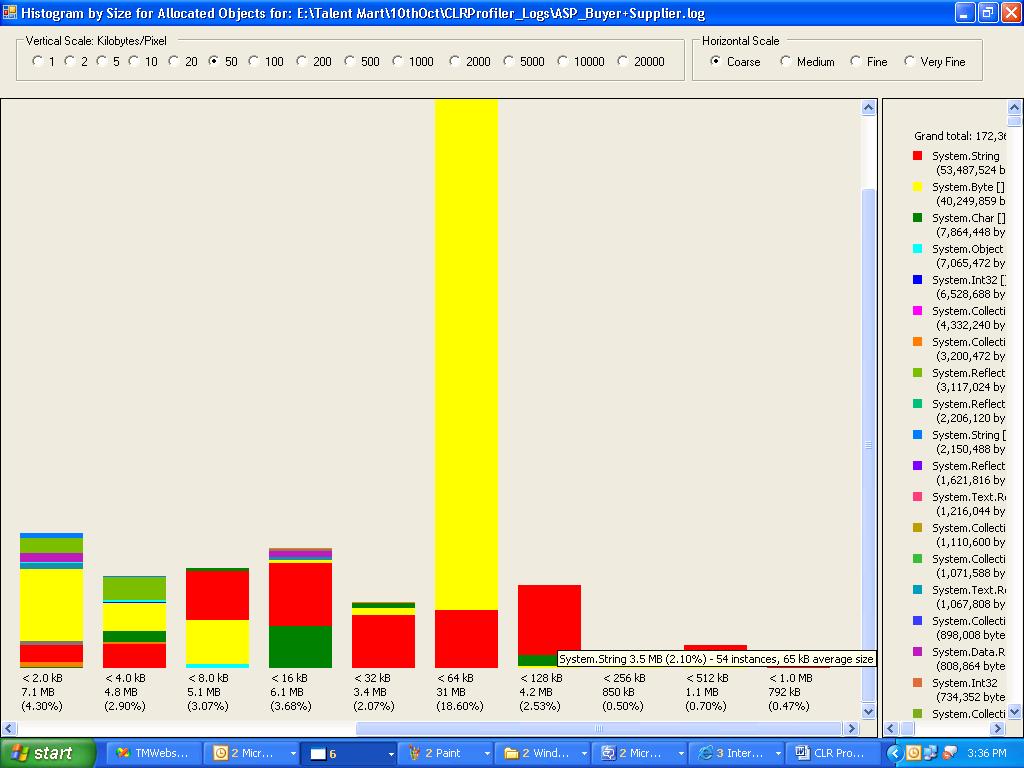
As we can see here, there are 1,68,037 instances of strings that have been created of size < 64 bytes. One of the main reasons for this would be the fact when we concatenate strings, a new instance of the string is created with the same name, but the old instance is not removed. To improve this situation, we can use string builder objects instead of strings.
To begin with let us modify a small piece of code in one of the user controls (i.e. using sting builder instead of string). The following code snippet depicts the change. One of the properties in the code
public  string SelectedObjectvlaue
{
    get
    {
        string selText = string.Empty;
        foreach (System.Web.UI.WebControls.ListItem li in DDList.Items )
        {
            if (li.Selected )
            { selText += li.Text + ","; }
        }
        if (selText.Length > 0)
         selText = selText.Length > 0 ? selTExt.Substring(0,selText.Length-1) : selText;
        return selText;
    }
    set
    { _SelectedObjectvlaue=  value;
     DDLabel.Text    =  _SelectedObjectvlaue;
     DDLabel.ToolTip =  _SelectedObjectvlaue;
    }
}
The same property as above, but with the necessary code modifications.
public StringBuilder
SelectedObjectvlaue
{
get{ StringBuilder selText = new StringBuilder();
foreach (System.Web.UI.WebControls.ListItem li in DDList.Items )
{
if (li.Selected )
{
selText.Append(li.Text).Append(',');
}
}
if (selText.Length > 0)
{
String strTemp; strTemp = selText.ToString();
if (selText.Length > 0)
{
selText.Remove(0, selText.Length);
selText.Append(strTemp.Substring(0, strTemp.Length - 1));
}
} return selText;
}
set
{ _
SelectedObjectvlaue
= value;
DDLabel.Text = _SelectedObjectvlaue; DDLabel.ToolTip = _SelectedObjectvlaue; }
}
Two properties were changed in the entire coding. After the changes were done, when the profiler was ran. Profiling for the application after the code changes:
Snap shot of the profiling summary:
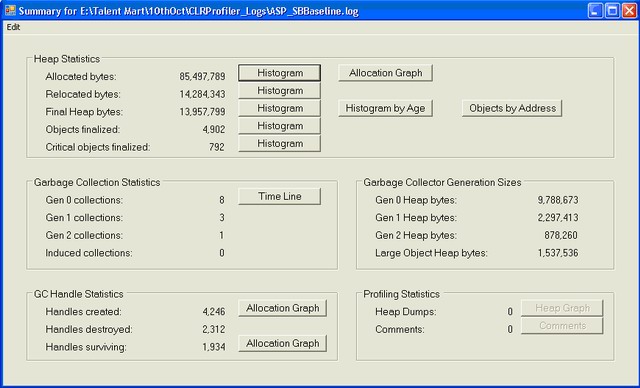
There has been a remarkable change in the Allocated bytes section from 172,365,764 to 85,497,789. Similarly, the Relocated bytes have reduced from 32,073,455 to 14,284,343.
Replacing “String” with “String Builder” is one of the ways to improve Memory management. Other techniques could also be used like caching, Pooling, effective Session handling, etc.
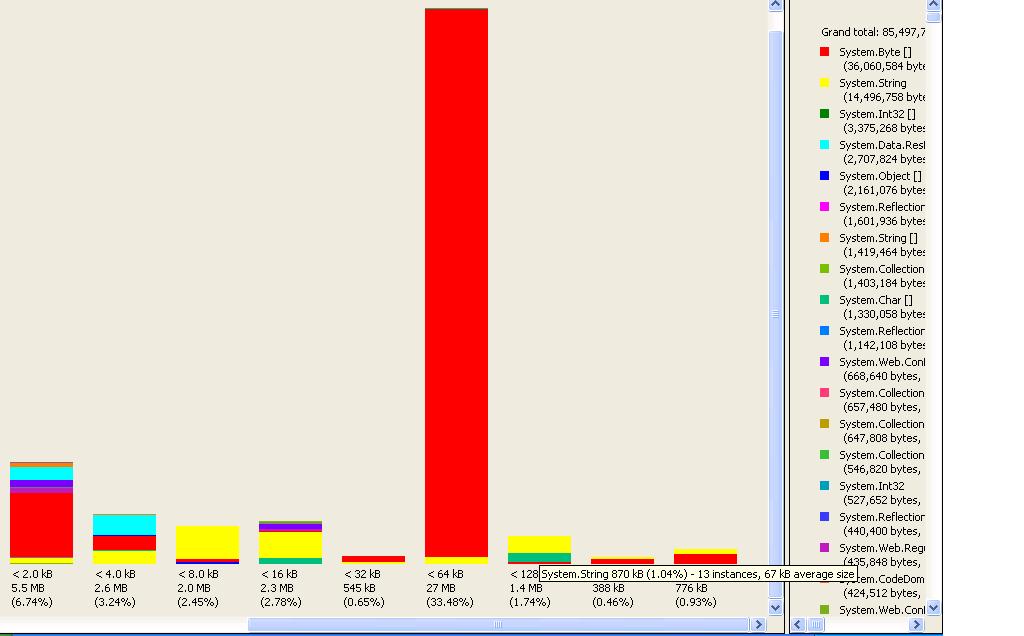
Allocated Bytes Histogram part 1:

Allocated Bytes Histogram part 2:
Comparison:
Total Allocated bytes before code changes: 172,365,764
After code changes: 85,497,789
Improvement in %age in Total Allocated Bytes: 50.397
String Instances created of size <64 bytes before code changes: 168,037 (7.1 MB) 44bytes average.
After code changes: 52,898 (2.4 MB) 46bytes average.
Improvement in %age of String instances (of <64 bytes) created: 68.52


0 comments:
Post a Comment